

Key Takeaways
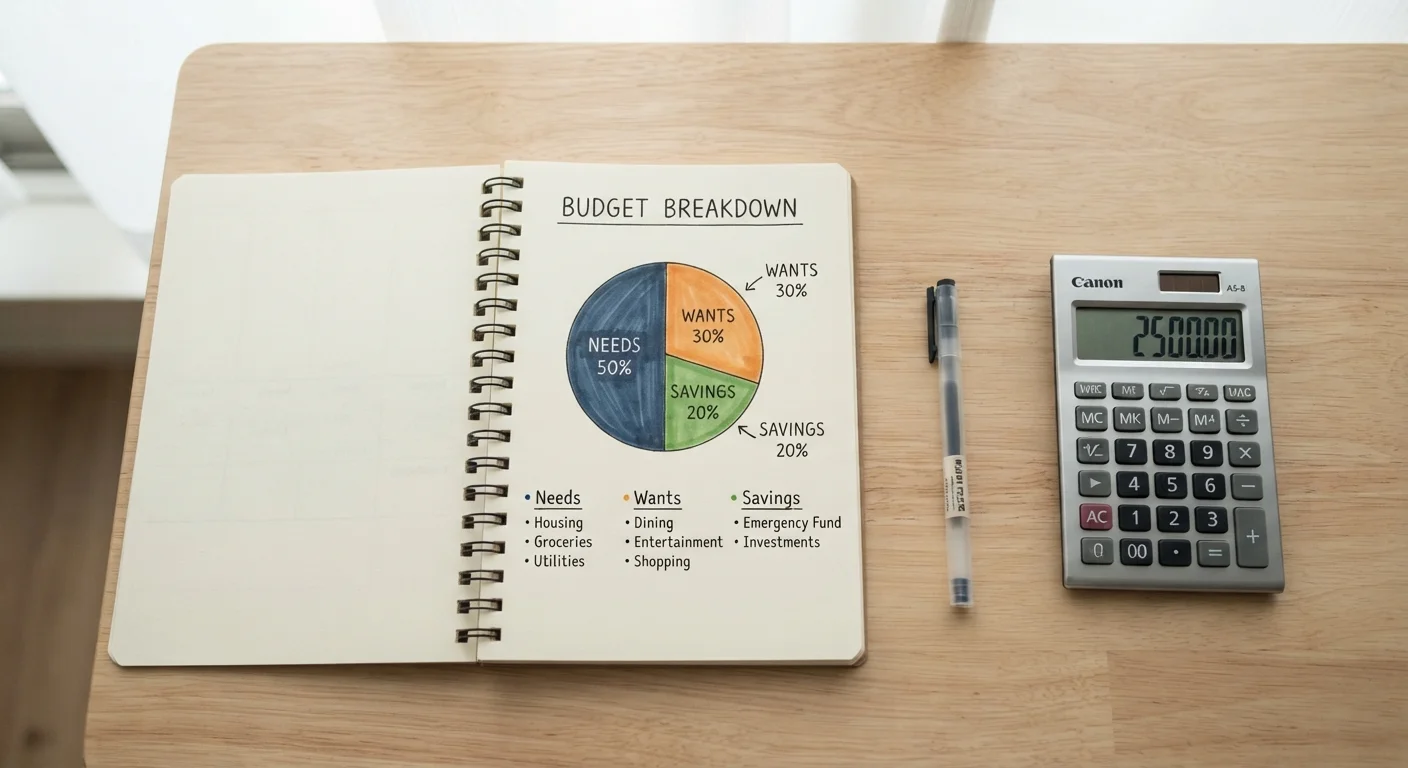
- The 50/30/20 rule splits after-tax income into needs (50%), wants (30%), and savings/debt (20%).
- Needs include essentials like housing, groceries, utilities, and minimum debt payments.
- Wants cover discretionary spending — dining out, subscriptions, entertainment, and hobbies.
- The 20% savings category can include emergency funds, retirement contributions, and extra debt payments.
- The rule is a starting framework, not a rigid prescription — adjust percentages to fit your actual situation.
- Higher cost-of-living areas or significant debt loads may make the standard ratios unrealistic for many households.
The 50/30/20 Rule
The 50/30/20 rule is a budgeting framework that divides your after-tax income into three categories: 50% for needs, 30% for wants, and 20% for savings and debt repayment. It's designed to give people a simple, percentage-based starting point for managing money without requiring detailed expense tracking. The goal is to balance current living costs, personal enjoyment, and financial security in one straightforward structure.
The framework is commonly attributed to Senator Elizabeth Warren and her daughter Amelia Warren Tyagi, who described it in their 2005 book 'All Your Worth.' It operates on after-tax (net) income, not gross income.
How the Three Categories Work
Understanding what belongs in each bucket is the most practical part of applying this rule. The labels sound simple, but the line between a need and a want is often blurry in real life. See our guide to categorizing needs, wants, and nice-to-haves for a more detailed breakdown.
Needs (50%)
Needs are expenses you cannot reasonably eliminate without serious consequences. These include rent or mortgage, utilities, groceries, health insurance premiums, transportation required for work, and minimum debt payments. The key test: if skipping it would put your housing, health, or employment at risk, it's a need.
Wants (30%)
Wants are discretionary spending choices — things that improve your quality of life but aren't strictly necessary. Dining out, streaming subscriptions, gym memberships, vacations, and clothing beyond the basics all fall here. This category is where most households have the most flexibility to adjust when budgets are tight.
Savings and Debt Repayment (20%)
This bucket covers emergency fund contributions, retirement account deposits, and any extra payments made on top of minimum debt obligations. Splitting your attention between building savings and reducing debt is a real tension many households face — our article on paying off debt while still saving walks through a practical framework for balancing both goals.
Start With What You Actually Spend
Before adjusting anything, pull two months of bank and credit card statements and categorize every transaction as a need, want, or savings contribution. Most people are surprised by how far their real spending diverges from what they assumed. This baseline audit is more useful than any budgeting app's automated suggestions.
Putting the Numbers Into Practice
To apply the rule, start with your monthly after-tax income. If you bring home $4,000 per month after taxes, the split looks like this:
| Category | Percentage | Monthly Amount |
|---|---|---|
| Needs | 50% | $2,000 |
| Wants | 30% | $1,200 |
| Savings & Debt | 20% | $800 |
Once you've calculated your targets, compare them against actual spending from your last two or three bank statements. Most people find that one category — usually needs or wants — runs over budget, which reveals exactly where adjustments are needed.
33%
Americans with no emergency savings
A Federal Reserve report on economic well-being found roughly one-third of U.S. adults would struggle to cover an unexpected $400 expense, underscoring why the savings bucket in this framework matters.
~30%
Median share of income spent on housing
The U.S. Bureau of Labor Statistics Consumer Expenditure Survey consistently shows housing as the single largest spending category, often leaving little room for the 50% needs target in higher-cost markets.
$6,000+
Average American household annual savings gap
Financial planning research suggests many households save significantly less than the 20% benchmark, highlighting how far typical spending patterns diverge from the rule's recommendations.
The rule also works as a diagnostic tool. If your needs consume 65% of your income, that signals a structural problem — rent may be too high relative to earnings, or a recurring essential cost needs renegotiating. For guidance on balancing near-term and long-term saving within this structure, see our piece on short-term vs. long-term savings strategies.
When the 50/30/20 Rule Has Real Limits
The 50/30/20 framework was designed as a general guide, not a universal solution. Several common situations strain or break its assumptions.
- High cost-of-living areas: In cities where rent alone can consume 40–50% of a moderate income, hitting the 50% needs target may be structurally impossible without significant lifestyle trade-offs.
- Low or irregular income: When income is tight, the 20% savings target can feel aspirational rather than achievable. Even saving 5–10% consistently has real long-term value and beats waiting until the numbers are "perfect."
- Heavy debt loads: Households managing student loans, medical debt, or high-interest credit card balances may need to redirect more than 20% toward debt repayment for a period before shifting focus to savings.
- Variable income: Freelancers, gig workers, and commission-based earners need to average income over several months rather than applying the rule month-to-month rigidly.
The rule is best treated as a starting reference point — a way to quickly audit whether your spending is broadly aligned with your goals. If the standard percentages don't fit, adjusting them is not failure; it's sound judgment. Our related article explores why the 50/30/20 rule doesn't work for everyone and covers concrete alternatives worth considering.
The Rule Uses After-Tax Income
Always apply the 50/30/20 percentages to your net take-home pay, not your gross salary. If your employer withholds taxes before your paycheck clears, your gross and net figures may differ by 20–30%. Using gross income as the base will produce targets that are impossible to meet in practice.
This article is for general informational purposes only and does not constitute personalized financial advice. Consult a licensed financial professional for guidance specific to your situation.